Draft agenda released, with keynotes by Robert Schaul, VP of Strategy, Limbik and Michael Bossetta
Datasets for Data Challenge 1, 2, and 3 are available on Google Drive, with submission instructions on GitHub.
You can submit your articles via EasyChair.
Co-located at ICWSM 2023, 5th June 2023 - Cyprus and online
This workshop seeks to establish the limits of current capabilities in understanding the role and use of images in online political discourse, from misinformation and disinformation to political advertising and mobilization.Imaging Protests
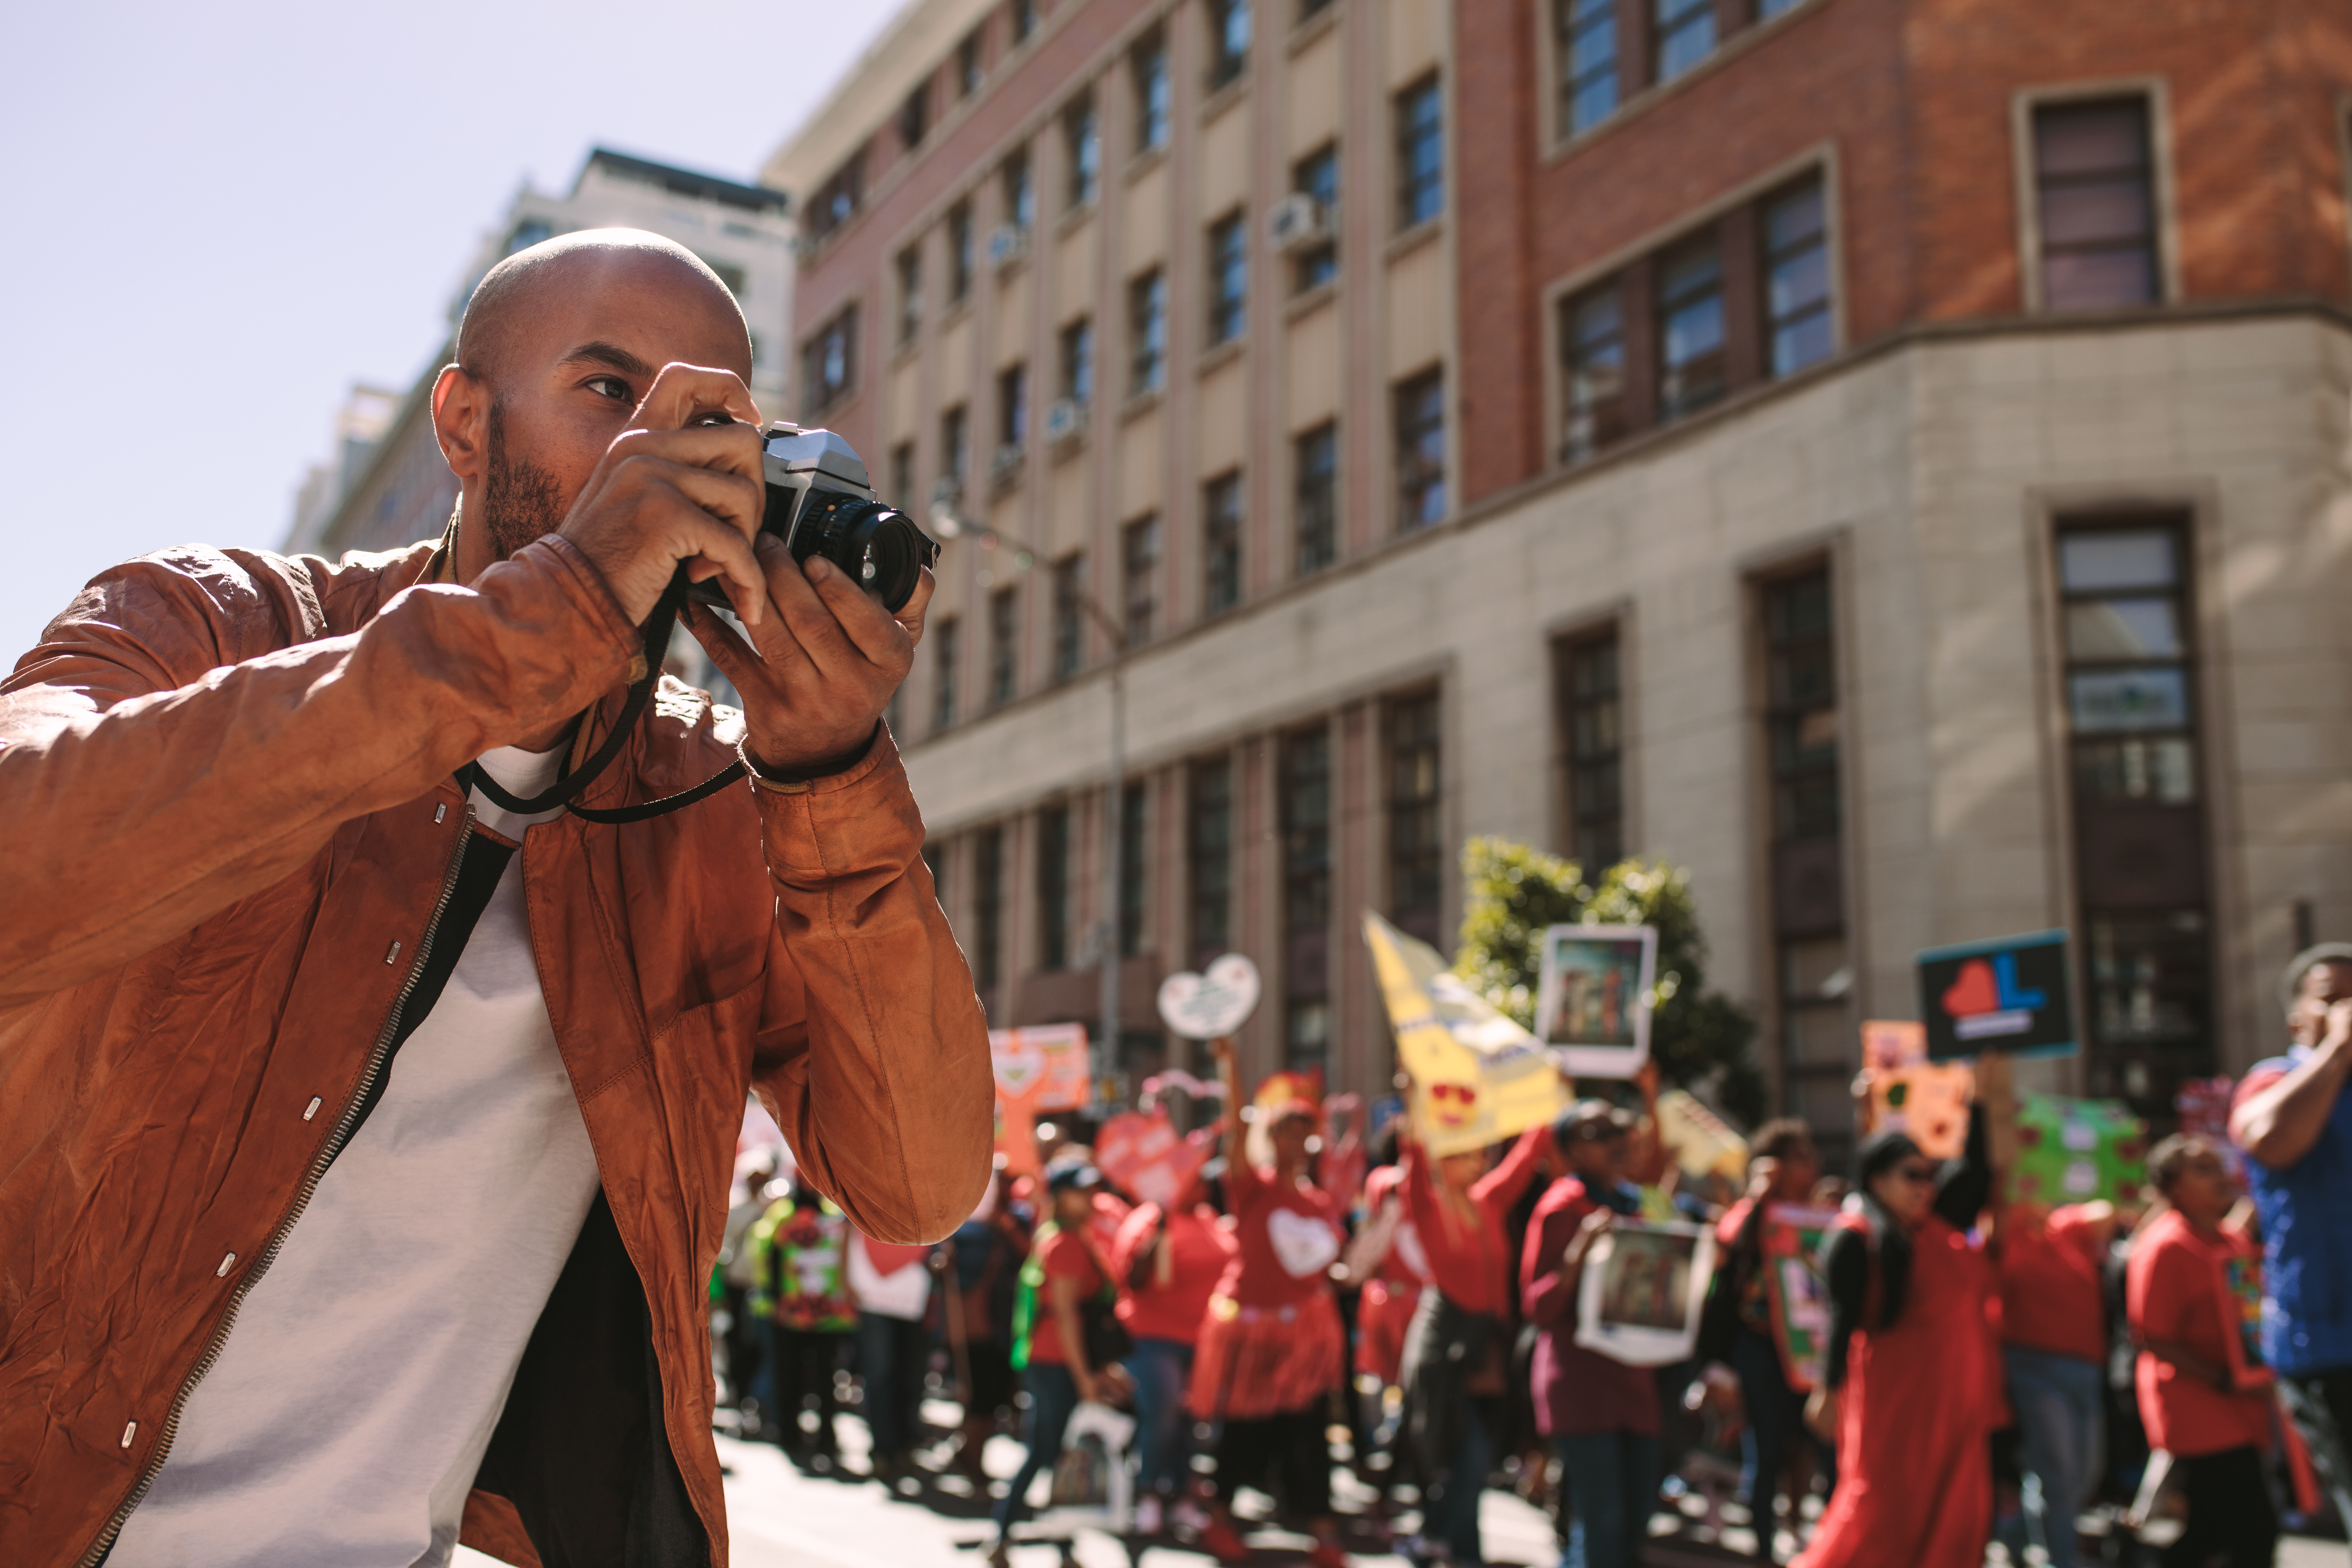
Exposure to images of demonstrations impact mobilization
Memes as Political Discourse
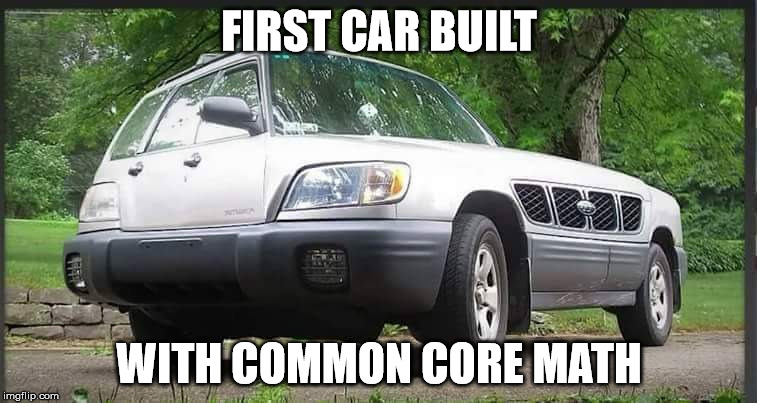
Memes are increasingly used to criticize political topics, provide vectors of incidental exposure to topics, and can influence public discourse
Sharing conspiracy theories
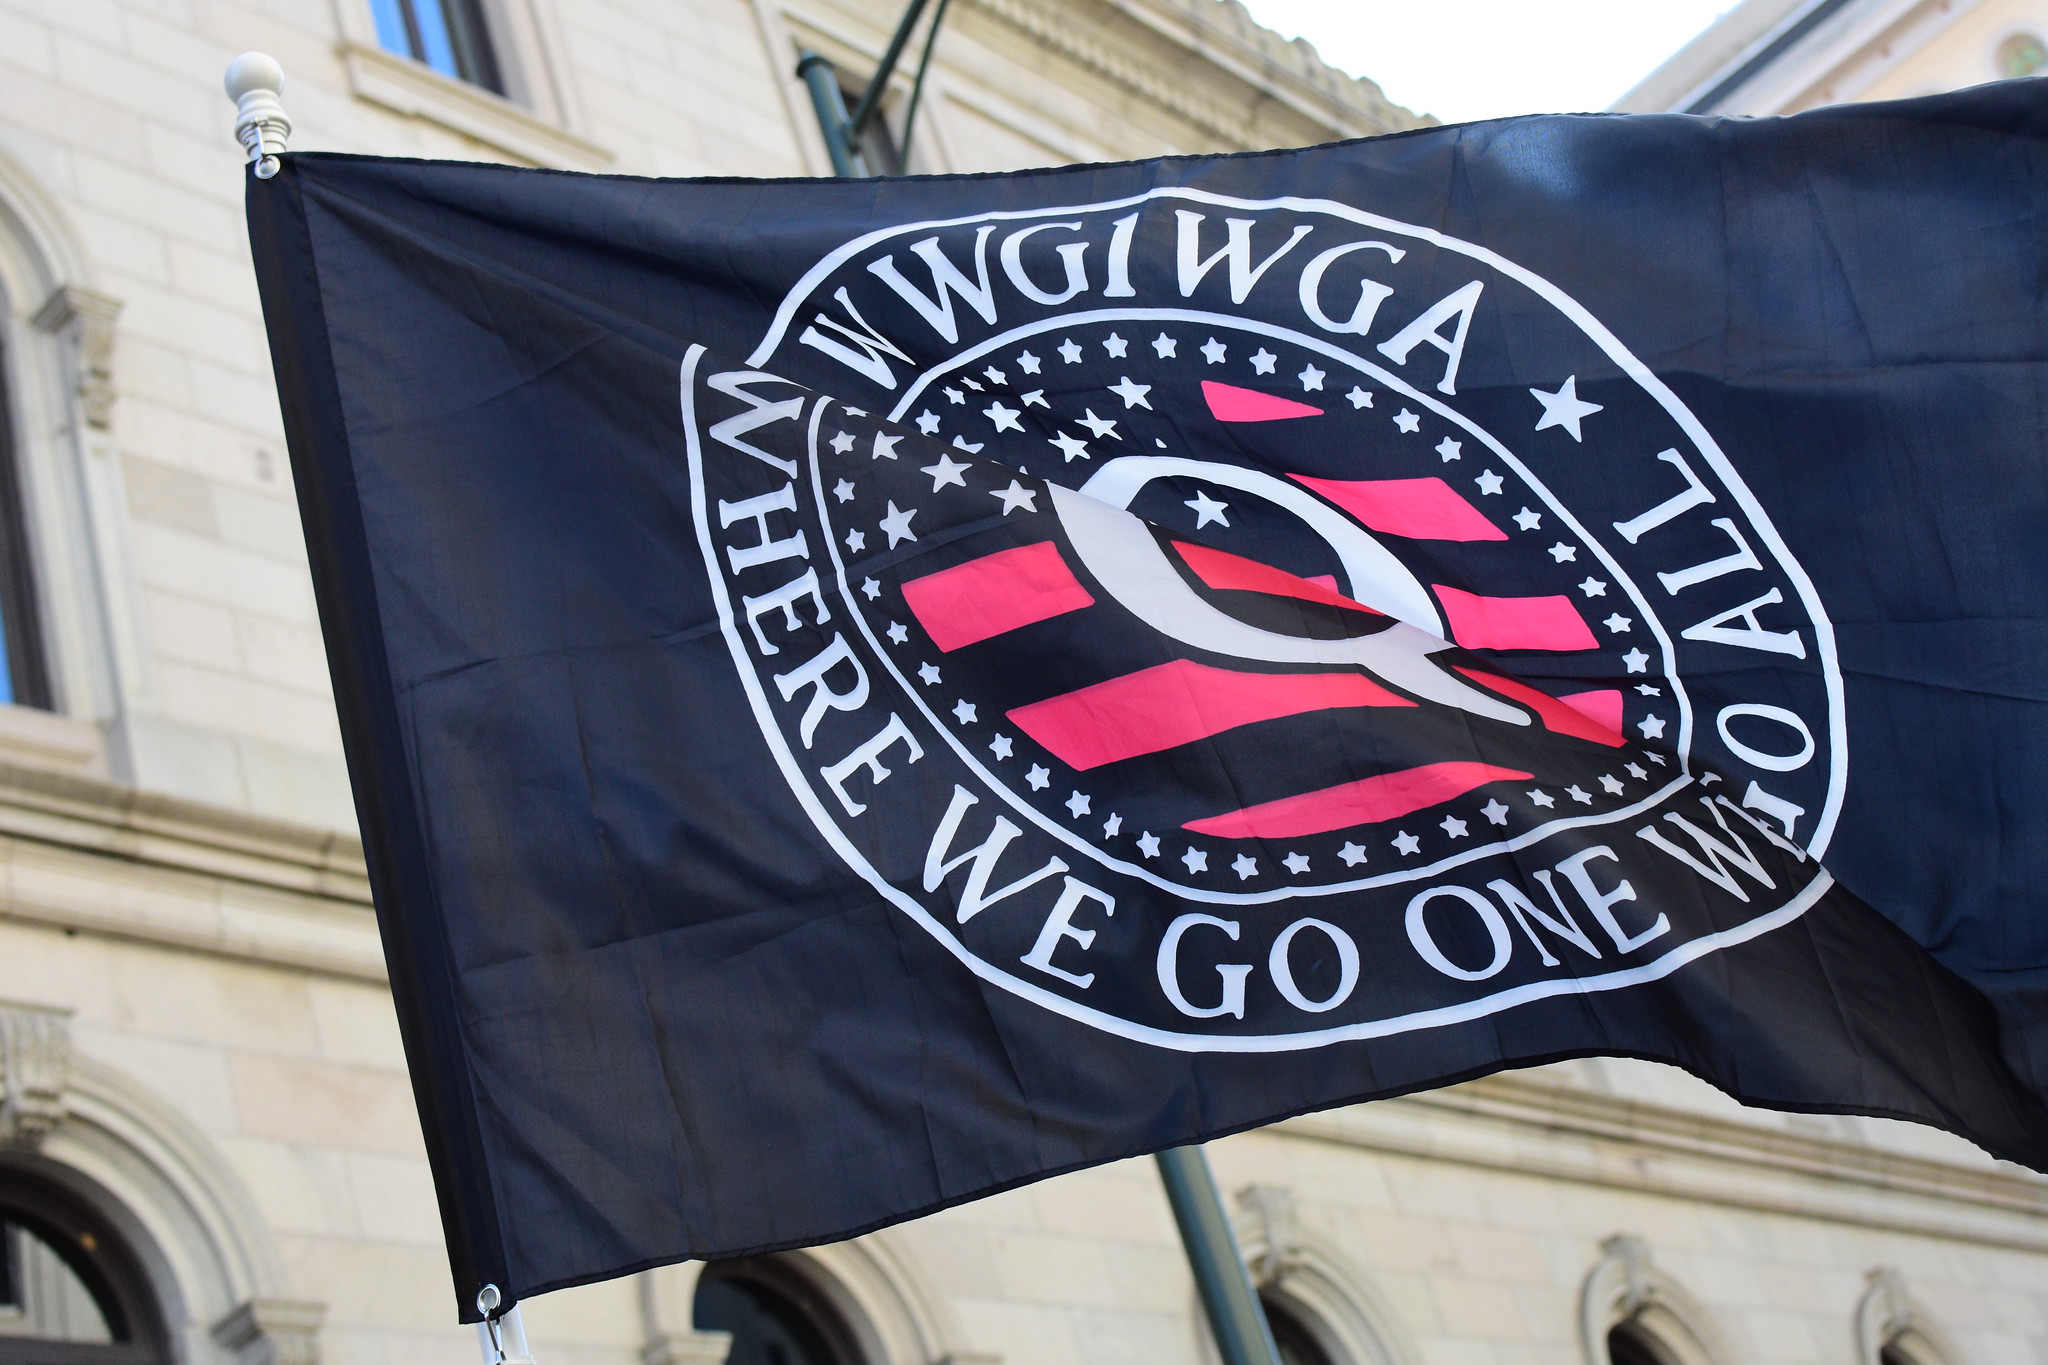
Images serve as a vector for exposure
Images and Online Political Discourse
Visual media has long been a key element of political discourse, and as new online media spaces increasingly focus on imagery (e.g., Instagram, Snapchat, and TikTok), new opportunities arise to study how politicians, political elites, and regular users use such imagery. Despite these advances, our understandings of how images are used for online political discussion, mobilization, advocacy, information sharing, and online manipulation lag behind our understandings of text.
This workshop exists in this context, with two core objectives: First, we wish to establish the current state of the art in its ability to handle the variety of imagery used in online social spaces. Second, we intend to allow individuals to advance this state of the art by releasing a dataset of images and two related challenge problems for understanding and tracking the use of images in political discourse.
Call for Papers
We invite researchers and practitioners to submit short papers describing an analysis of images in online social media spaces and political discourse, broadly defined. Submissions are expected to be 4 to 8 pages in length, plus unlimited pages of references. These papers will be archived in ICWSM’s workshop proceedings unless authors request otherwise.
Topics include:
- Analysis of image types (photos, memes, cartoons, etc.),
- Impacts of images on political mobilization,
- Use of screenshots to circumvent platform moderation,
- Identifying symbols of hate in online discourse,
- Identifying hate symbols embedded in images,
- Image appropriation for anti-social messaging,
- Understanding meanings of visual memes,
- Integrating message context with visual media,
- Tracking spread of images across platforms,
- The categories of images used in misinformation,
- Tracking conflicts with visual media,
- Measuring multi-modal user behavior, and
- Documenting antisocial gestures in presidential debates.
Papers should be submitted through EasyChair and use the AAAI author kit.
The workshop invites authors to submit three types of papers:
- Research Papers (8+ pages)
- Work-in-Progress Papers or Research Proposals (2-4 pages)
- Provocations or Critical Approaches (1-2 pages)
Awards for Best Papers and Best Posters
At the workshop, we will share awards for the best paper and best data challenge poster! We look forward to seeing your submissions and recognizing as many as we can.
Data Challenges
This workshop includes a data challenge, wherein we will release a large-scale dataset of images used by politicians, images shared by disinformation agents, and a sample of images shared in otherwise political contexts. Using this dataset, we are soliciting solutions to address the following challenges:
- Challenge 1: Identifying Influence Campaigns via Imagery While many efforts have worked to characterize influence campaigns (foreign or domestic, inauthentic and authentic), much of these efforts focus on text despite the multi-modal nature of these campaigns. Text is cheaper to produce and analyze, but images are more expensive and more engaging, making images both a potential vector for identifying coordinating accounts and key modality for measuring impact. This challenge asks for systems to use image-characterization methods to classify social media accounts into authentic or campaign accounts, where the campaign label is decomposed into sub-labels across several influence campaigns.
- Challenge 1 Test Dataset:
- Challenge 1 Training Data:
- Raw images and their embeddings from US politically interested audiences and from three Twitter-identified disinformation campaigns (Russia, Iran, Venezuela) here
- Challenge 2: Screenshot Sharing and Propagation As screenshots are increasingly used for reporting quotes and actions of elites across platforms, methods for tracking and attributing these screenshots to individuals are increasingly useful for establishing provenance and propagation paths. To this end, we must first understand how to separate screenshots of duplicate content. Systems submitted for this challenge will identify and cluster duplicate screenshots while being robust to cropping or resizing.
- Challenge 2 Test Dataset (same dataset as CP1):
- Challenge 2 Training Data:
- Challenge 3: Hate Symbols in News Images As producers of hate speech grow more sophisticated, images containing antisemitic and other racist symbols have successfully penetrated both social media and news coverage. How hate symbols are spread and potentially amplified by news outlets and social platforms has thus far been difficult to quantify given the complexity of image processing and the massive volume of visual media in online spaces. This challenge provides data from the ADL Hate Symbols Database (over 200 images as well as transformations produced using image augmentation algorithms) with the goal of developing classifiers to detect the likelihood that an image contains hate symbology. Questions center on whether hate symbols can be detected within larger visual datasets, such as protest coverage, and whether images can be rated on the probability of containing images that have recurrent characteristics of hate symbols.
- Challenge 3 Test Dataset (same dataset as CP1):
- Challenge 3 Training Data:
- Challenge 4: Antisocial Gestures in Presidential Debates The rise of populism and a contentious style of politics has placed a growing premium on displays of aggression in political debates. This is particularly true at the presidential level where candidates compete for viewer attention and political dominance. The antisocial gestures associated with aggression and contention on the debate stage are an important but often overlooked aspect of political behavior. This challenge provides C-SPAN videos and training set data (20% of each first presidential debate from 1980-2020 annotated at 10-second increments for a range of gestures and movements) with the goal of developing classifiers of the prevalence of antisocial gestures in televised debates. Questions include whether antisocial gestures align with aggressive facial expressions, voice tones, and language use, and whether these characteristics have increased or decreased over time.
Data Challenge Posters
For those participating in the Data Challenge, we will ask they submit a challenge paper, which should contain the following elements:
- A description of the solution that you are proposing
- An evaluation of the solution
- A discussion of the implications of your solution and results
We highly encourage the source code of the solution to be included with the submission (e.g., in a GitHub repository), but this is not mandatory for acceptance of a data challenge paper.
The page limit for challenge papers is 4 pages (including all figures and tables) and unlimited references. All challenge papers will be reviewed by at least two program committee members. The best data challenge paper will be awarded by the track chairs and the program committee members.
Results of the data challenge will be shared at the workshop.
Data Challenge Links
Datasets for these challenges are available via the PhoMemes GitHub repository and Google Drive.
Challenge datasets for CP1 and CP2 is organized into folders for the two modes (image embeddings, and a subsample of raw images), and each folder has a set of sixteen partitioned files, of the form [0-9a-f].partition.tar. Where the prefix of that partition denotes the first hexadecimal character of a hashed account ID.
To work with either the raw images or the embeddings, you should download the 16 partitioned TAR files and unzip them.
Data Challenge Scaffolding
We also provide some scaffolding code for working with this data, especially for connecting embeddings to the subsample of raw images. This scaffolding includes:
-
Scaffold-MapEmbeddingsToImageIDs.ipynb– Code to join embeddings gathered from each account in the training data to the corresponding image ID. This image ID corresponds to an image filename, which may be available in the Raw Actor Images dataset. -
Scaffold-MapEmbeddingsToImageIDs-ClusterVisualization.ipynb– Building on the mapped embeddings-to-image-IDs, we use the full embedded dataset for all actors and apply k-means to it to identify clusters within the image data. Then, we test for which embeddings we have raw images and use those raw images to characterize each cluster and visualize them in a single-level treemap.
Timeline
- Data Challenge Release: February 15th
- Paper Submission: April 1st Updated
- Paper Notification: April 17th Updated
- Camera-Ready Paper Submission: April 24th
- Data Challenge Poster Submission: May 1st
- Poster Notification: May 15th
- ICWSM22 Workshop Day: June 5th
Data Challenge Going Forward
Data challenge submissions and relevant instructions are available on GitHub.
To submit, check out those directions, fork our repository, add your runs, and submit a pull-request. We’ll run our evaluation code against your submission and add them to the leaderboard.
Agenda
Morning Session 9:00 AM – 12:00 PM (All times local)
- 9:00-9:15 Opening Remarks and PhoMemes 2023 Overview
- 9:15-9:50 Keynote #1 - “Moving to the Left of Boom: Harnessing Technology to Mitigate Risk in the Information Environment”, Robert Schaul, VP of Strategy, Limbik
- Bio: Rob is the Vice President of Strategy for Limbik, a data science and technology company that deploys solutions which identify disinformation online and quantify its potential for impact while also optimizing targeted responses. Prior to Limbik, Rob was a founding member of the Countering Foreign Influence Task Force within the Department of Homeland Security-CISA. While a part of CISA’s Mis- Dis- and Mal-information (MDM) Team, Rob’s portfolio included engaging international counterparts, maintaining a counter disinformation practitioner network, steering analytic research and policy development, and developing analytic capabilities. Recently, Rob served as the Government point-person for foreign influence stemming from the Russian invasion of Ukraine, aligning 16+ agencies toward domestic preparedness and resilience.
- 9:50-10:05 Keynote Q&A
- 10:05-10:30 Research Agenda-Setting Exercise
- 10:30-11:00 ☕️ Coffee Break / Posters ☕️
- 11:00-12:00 Panel Discussion, A Multimodal Research Agenda
Lunch (12:00-2:00)
Afternoon Session
- 2:00-2:05 Welcome Back
- 1:45-2:45 Keynote #2 - “Political Faces in Online Spaces: The Potentials and Pitfalls of Computer Vision for Digital Campaigning Research”, Michael Bossetta
- Bio: Michael is an Assistant Professor in the Department of Communication and Media at Lund University, where he specializes in the impact of social media on politics. His research focuses on how politicians and citizens use social media during elections. Michael also produces and hosts the Social Media and Politics Podcast, an interview-driven podcast aiming to disseminate research findings to the public. The show has over 175,000 downloads from 150+ countries.
- 2:45-3:00 Keynote Q&A
- 3:00-3:30 Paper Session #1, Long Papers
- 3:30-4:00 ☕️ Coffee Break / Posters ☕️
- 4:00-4:30 Paper Session #2, WiPs
- 4:30-4:50 Data Challenge Lightning Talks and Awards
- 4:50-5:00 Looking Forward and Closing Remarks
Organizers
 Erik Bucy
@erikpbucy
he/him
College of Media and Communication, Texas Tech University.
 Cody Buntain
@cbuntain
he/him
College of Information Studies, University of Maryland, College Park.
 Keng-Chi Chang
@kengchichang
he/him
Department of Political Science, University of California, San Diego.
 Jungseock Joo
@jsjoo3
Departments of Communication and Statistics, UCLA.
 Navin Kumar
Yale School of Medicine.
 Dhavan Shah
@dvshah
School of Journalism and Mass Communication, University of Wisconsin-Madison.
